Sometimes, when trying to debug an MVC method, you need to inspect what the app is receiving from the client. You could use a sniffer, like WireShark, but I believe there is an easier way.
The Problem
Some time ago I was tasked with integrating with a third party app. The app called out to a web service to do some work. My task was to create that web service. But there was no documentation about how to configure the end points. The app took a domain and that was all.
I have recently found that the solution to this problem quite handy when trying to debug an AJAX call to an MVC controller method.
The Solution
What I did was create a basic MVC solution and ran it through Visual Studio in debug mode. I then changed the domain (and port) on the third party app to point to my PC. Then when the app made the call the solution received it and I could then see what was sent and to where.
To do that, add this code to Program.cs
app.Use(async (context, next) =>
{
try
{
logger.Debug($"Request path {context.Request.Path} + {context.Request.Method}");
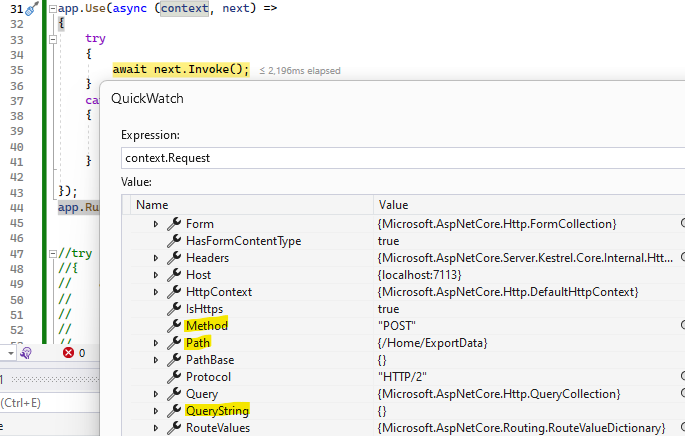
await next.Invoke();
}
catch (Exception e)
{
logger.Error(e);
throw;
}
});
app.Run();Put a breakpoint on await next.Invoke() and make the call.
Debugging an AJAX call to an MVC method
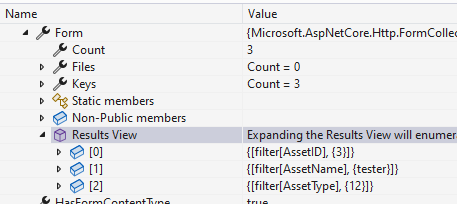
I was making a call from AJAX, but the object I was sending was not being received by the controller method. To find the problem I simply added the solution above and I was able to see what was passed to my controller by looking at the Form data, I could then use that to determine why it wasn’t be received by my method.